
Let's face it. Most event ROI content gets dismissed before you even finish reading the title.
And honestly, we get it.
Raise your hand if you've ever read an ROI-focused article that:
-
Was clearly written for Google or AI, not actual humans
-
Offered advice from someone who's probably never worked an event
-
Acted like every brand, event, and activation should measure success the exact same way
Our hands are all the way up for all three. 🖐️🖐️🖐️
But here's the thing. As a manufacturer of custom event infrastructure and trade show exhibits, we're part of the bigger conversation around event investments and what makes them worthwhile.
So we teamed up with Jenna Gullotti and Candice Bakke from Captello to put together something more useful: a straightforward approach to measuring event ROI, with practical advice for three very different types of activations, including helpful tools to make sure you can actually measure against your goals.
In This Month’s Issue: Practical ROI Advice for 3 Types of Activations
The ROI Formula (Don’t Worry, We’ll Show You How To Apply It) - A step-by-step approach to working backward from your business goals to the KPIs and measurement tools that actually matter.
Applying the Formula: B2B Tech Trade Shows: Pipeline & Revenue - Which metrics to track before, during, and after a trade show, plus the tools and tactics that help connect booth conversations to closed revenue.
Applying the Formula: Beverage & Product Sampling: Trial to Purchase - How to measure sampling effectiveness, capture consumer data, and connect product trials to actual purchases.
Applying the Formula: Fan Experiences: Audience Growth & Sponsor Value - How to measure fan engagement, grow your first-party audience, and demonstrate ROI to sponsors and partners.
Thanks to our special guests this month!
*Not a Sponsored Post
When we were exploring how we'd cover a topic as complex as ROI, we wanted help from people with experience. We reached out to the Captello team to see if they'd be interested in helping us put this together.
They said, "Heck Yes!" And that lead to this collaborative article between our two teams.
Working Backwards from Success: A Simple Formula
Most event ROI conversations go sideways because teams start with what is easy to count, not what actually matters.
Badge scans, foot traffic, and social impressions are easy to report.
They rarely answer the question leadership is asking: did this event move the business forward?
Working backwards flips the order. You decide what success looks like first, then build backward to the metrics and the systems that prove it.
The right answer changes by activation type. A trade show booth, a sampling tour, and a fan experience exist for different reasons, so they should be judged differently.
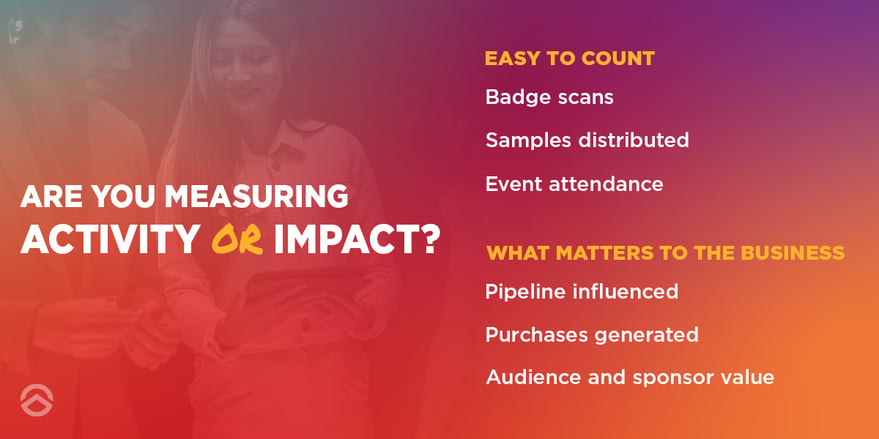
Here is the formula we recommend:
-
Define your end goal - Name the one business outcome this activation exists to drive. Pipeline and revenue, product trial and purchase, or audience and brand affinity are common answers. Pick one primary goal, and write it in the language your leadership already uses.
If you can't say it in one sentence, the event doesn't have a goal yet. -
Plot the KPIs that influence and communicate that goal - Work backwards from the goal and ask what has to happen in order for it to occur. Each step is a KPI. Separate leading indicators you can see during the event (Conversations, qualified visitors, opt-ins) from lagging indicators that show up later (meetings, purchases, renewals).
Leading indicators let you adjust in real time. Lagging indicators prove the impact. -
Build the measurement system that captures each KPI - For every KPI, decide how it gets captured, who owns it, and where the data ends up. Capture should happen at the moment of interaction, not from memory after the show.
The data should land in the system where the end goal is measured, usually the CRM or marketing platform, so the event is connected to the outcome rather than reported in a separate spreadsheet. -
One rule ties it together - every KPI should earn its place. If a metric doesn't influence the end goal or help you explain it, stop tracking it.
A shorter list of metrics that connect to the outcome is more persuasive than a long dashboard that doesn't.
Applying the Formula
Example 1: B2B Technology Trade Show Exhibitors
End goal: Influencedced pipeline and revenue
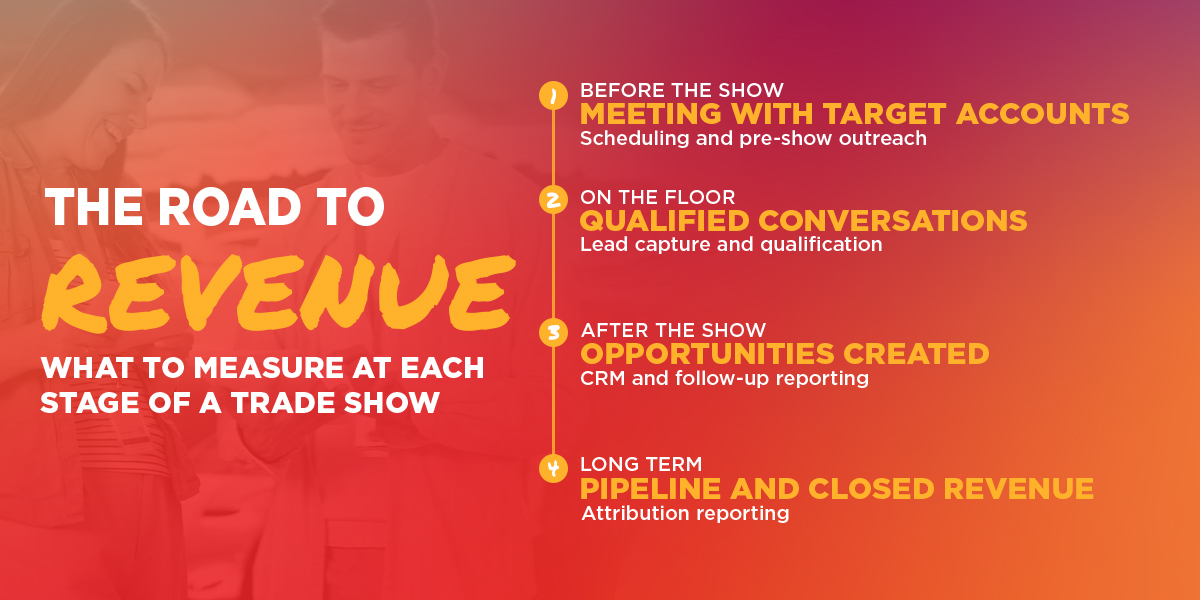
B2B trade shows are some of the most expensive line items in a marketing budget, and buying cycles can be long. The booth isn't necessarily there to close deals on the floor. It's there to start or accelerate the right conversations with the right accounts. So the goal is pipeline created or moved forward because of the event, tracked all the way to revenue.
Potential Metrics Along The Way
|
Stage |
KPI |
How to measure |
|
Before the show |
Meetings booked with target accounts |
Pre-show outreach and a scheduling link tied to your account list |
|
On the floor |
Qualified conversations, not total scans |
Qualifying questions captured at the moment of the conversation |
|
On the floor |
Target-account coverage |
Captured leads matched against your target-account list |
|
After the show |
Speed to follow-up |
Time from capture to first sales touch, tracked in the CRM |
|
After the show |
Meetings and opportunities created |
Opportunities tagged with the event as a campaign source |
|
Long term |
Pipeline and closed revenue influenced |
Lead-level attribution reporting in the CRM |
Tools and mechanisms that make it easier
-
Book meetings before the show - Reach target accounts ahead of time with a scheduling link, and track each meeting from booking to outcome. Meeting tools like Captello's keep meeting management platform, and their results connected to the same lead record.
-
Draw the right traffic, not just more of it - A game or challenge pulls people into the booth, and building one qualifying question into the play means every participant arrives with context, not just a badge.
-
Qualify, don't just scan - Load three to five qualifying questions into your lead capture app, such as timeline, role in the decision, and the problem they're trying to solve. A scan with context is a lead.
-
Enrich at capture - Business cards and badge data are often incomplete. Enrichment fills in company, title, and contact details so sales gets a usable record.
-
Send leads to the CRM in real time - If leads sit in a spreadsheet until the team gets home, the hottest conversations go cold. Real-time sync with personalized messaging recommendations from an integrated AI Agent with automated follow-up keeps momentum on track.
-
Track every lead, not just the event - Tagging the event as a campaign source shows that the show influenced the pipeline. Tracking each lead and meeting through to the closed deal shows which conversations produced revenue, and that's the proof leadership trusts.
|
Tool |
What It Helps Accomplish |
Which KPI It Helps Measure |
Practical Application |
|
Schedule meetings with target accounts before the event |
Pre-show meetings booked; meeting attendance |
Share personalized booking links during pre-show outreach and connect scheduled meetings to your CRM |
|
|
Capture and qualify leads onsite |
Qualified leads; target-account coverage; lead quality |
Scan badges, record qualifying answers about buying timelines and needs, and sync data to the CRM |
|
|
Enrich leads and personalize post-show engagement |
Lead engagement; follow-up activity; content interactions |
Capture conversation notes, deliver relevant content after the show, and monitor prospect engagement |
|
|
Combine lead capture, meeting management, qualification, gamification, and CRM integrations |
Qualified conversations; engagement; booked meetings; lead-to-opportunity conversion |
Book and manage meetings before, during and after events, use interactive booth activities to attract visitors, collect qualifying information, and route leads into sales workflows in one platform |
|
|
Connect event activity to sales opportunities and revenue |
Opportunities created; influenced pipeline; closed revenue |
Associate event contacts and interactions with CRM campaigns and deals to evaluate downstream outcomes |
|
|
Track event-sourced and event-influenced opportunities |
Pipeline generated; opportunity progression; closed-won revenue |
Use campaign membership and opportunity reporting to monitor how event relationships contribute to revenue |
Activation in Action: Surgere at Manifest 2026
If qualified conversations matter more than collecting a mountain of badge scans, how can the design of your exhibit help make those conversations happen?
Here's one example from our team at World Class Displays.
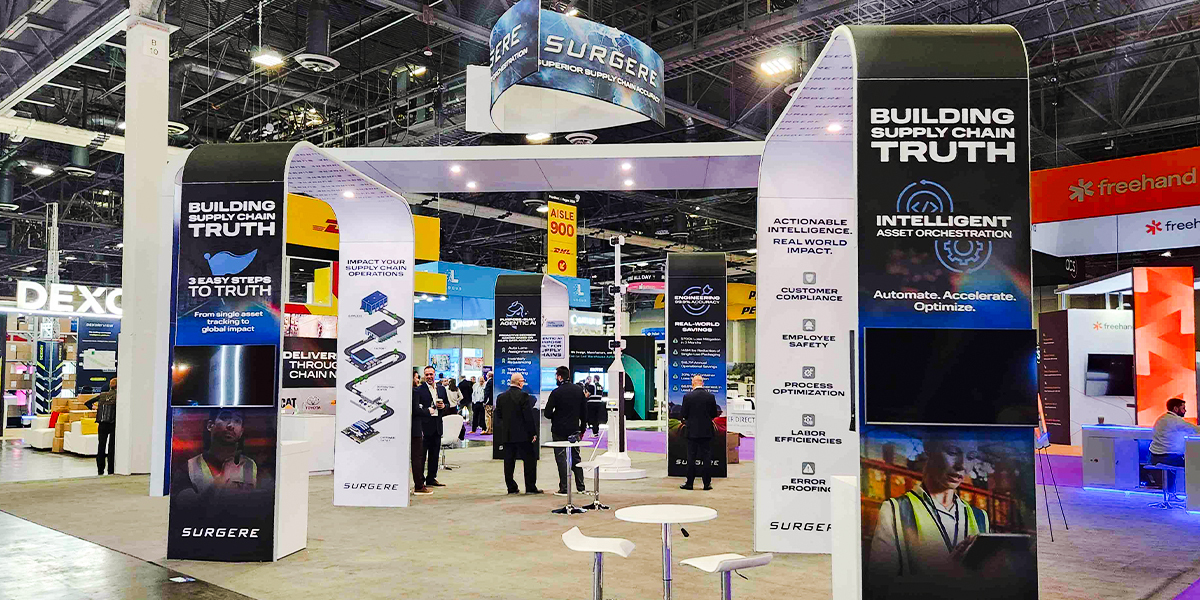
We worked with Surgere to create a 40' x 50' trade show exhibit for Manifest 2026, with an open layout, strategically placed graphics, and video displays that helped communicate a pretty complex technology story.
Why does that matter? An open layout makes it easier for prospects to approach your booth. Clear messaging helps the right people understand what you do and why they should care. And giving those conversations room to happen creates more opportunities to qualify prospects and build relationships.
Of course, you'll still need the right tools and follow-up process to connect those conversations to pipeline and revenue. But designing your exhibit with those interactions in mind is a great place to start.
See Surgere's exhibit in action ⇒
Example 2: Beverage and Product Sampling
End goal: Trial that converts to purchase
Sampling exists to put the product in someone's hand and turn that moment into a future sale. Counting samples handed out only proves the team was busy. We want to know how many tasters became buyers, and whether you can reach them again.
Potential Metrics Along the Way
|
Stage |
KPI |
How to measure |
|
At the activation |
Samples distributed, by location and time |
Counts logged per shift and site |
|
At the activation |
Sample-to-opt-in rate |
Opt-ins captured divided by samples distributed |
|
At the activation |
Product feedback and purchase intent |
One or two quick questions at the moment of tasting |
|
After the activation |
Offer redemption |
Unique coupon or QR codes tied to each site |
|
After the activation |
Purchase lift near activation sites |
Retail or distributor sales data compared with similar non activated areas |
|
Long term |
Repeat engagement |
Email or SMS engagement from opted-in consumers |
Tools and mechanisms that make it easier
-
Give people a reason to opt in. A coupon, a giveaway entry, or a game turns an anonymous taster into a known contact. Gamified activations make the exchange feel fun rather than transactional.
-
Keep the questions short. Ask one or two questions, such as flavor preference and likelihood to buy. Every extra question costs you opt-ins.
-
Use unique codes per site. Site-specific QR codes or coupons tie redemptions back to the exact location, day, and team.
-
Capture offline. Sampling often happens in parking lots and festivals with weak signal. Use a capture tool that works offline and syncs later.
|
Tool |
What It Helps Accomplish |
Which KPI It Helps Measure |
Practical Application |
|
Collect onsite feedback, including offline |
Product preferences; purchase intent; survey participation |
Ask consumers one or two questions immediately after sampling to understand preferences and likelihood to purchase |
|
|
Capture consumer opt-ins and automate follow-up |
Sample-to-opt-in rate; email/SMS engagement; repeat engagement |
Invite samplers to opt into follow-up offers, then segment audiences by activation location or product interest |
|
|
Create and track promotional offers |
Coupon redemption rate; offer-attributed purchases |
Issue unique promotional codes for each activation location and compare redemption performance |
|
|
Track ecommerce purchases associated with activation offers |
Discount-code redemptions; attributed online sales; average order value |
Assign location-specific discount codes and analyze purchases using Shopify's sales and discount reports |
|
|
Analyze retail sales performance and market-level impact |
Retail sales lift; purchase trends; repeat purchasing where data is available |
Compare retail sales in activated markets against suitable control markets to investigate incremental purchase impact |
|
|
Collect consumer information through games, giveaways, and interactive engagement like scavenger hunts |
Consumer opt-ins; engagement participation; survey responses |
Use a spin-to-win game or giveaway to encourage consent-based registration and collect a small amount of product feedback |
Activation in Action: Powerade at the NCAA Championships
If you're wondering what it looks like when you start building those opportunities for engagement into an actual event space?
Here's one example from our team at TentCraft.
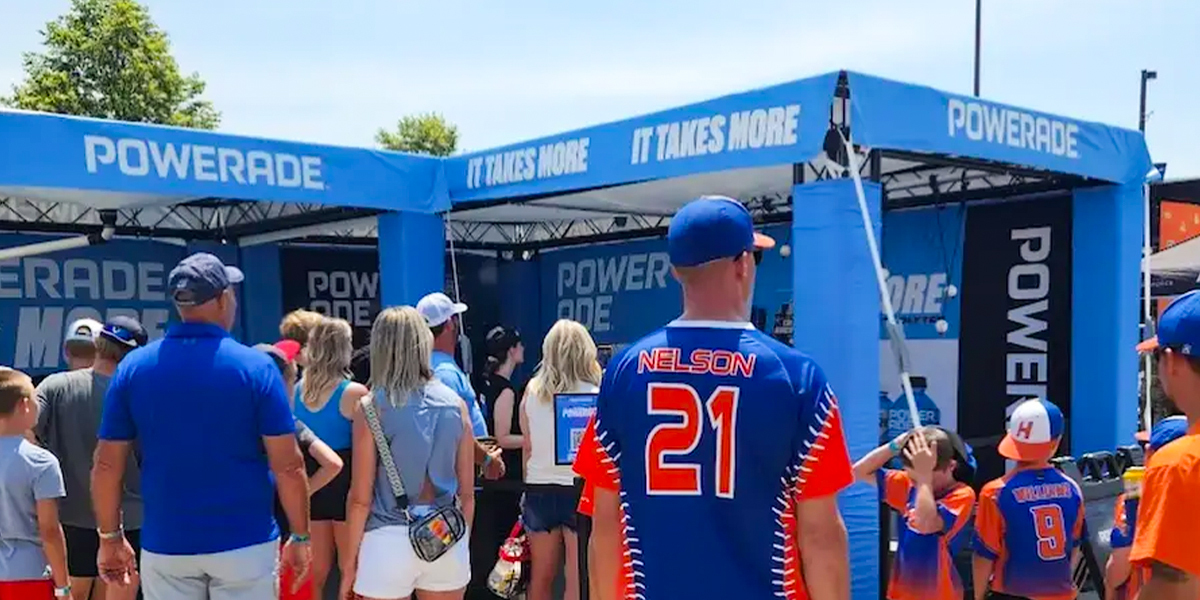
We worked with Powerade to create a modular truss setup for multiple NCAA championship events, bringing beverage sampling, athletic challenges, and branded photo opportunities together in one space.
Why does that matter? Because each interaction creates a different opportunity to learn something. Sampling gets the product into people's hands. Games give them a reason to stick around. And photo opportunities can extend the experience beyond the event itself.
Of course, you'd still need the right tools to measure those interactions and connect them to actual purchases. But designing your space around the experiences you want people to have is a pretty good place to start.
See the Powerade Activation Case Study ⇒
Example 3: Fan experiences
End goal: An owned audience and proven sponsor value
Fan experiences at stadiums, festivals, and tours are about affinity, not immediate sales. The lasting value is first-party data you can market to later, and engagement proof you can show sponsors and partners.
Potential Metrics Along The Way
|
Stage |
KPI |
How to measure |
|
At the experience |
Participation and dwell time |
Check-ins and time spent per station |
|
At the experience |
First-party opt-ins |
Registrations with consent captured at entry or play |
|
At the experience |
Social sharing and user-generated content |
Photo booth shares, hashtags, and tagged posts |
|
At the experience |
Sponsor engagement |
Interactions with sponsor-branded stations or games |
|
After the experience |
Fan sentiment |
A short post-event survey sent to opted-in fans |
|
Long term |
Audience growth and downstream revenue |
Email list growth, ticket or merch purchases, and sponsor renewals |
Tools and mechanisms that make it easier
-
Make the data exchange the fun part. Photo booths, trivia, spin-to-win, and scavenger hunts give fans a reason to register. Each registration becomes a contact with consent.
-
Build shareable moments. Branded photos and videos that fans post extend reach well beyond the people on site, and every share is trackable.
-
Report by sponsor. Tag each station or game to its sponsor so you can hand each partner a clear recap of the engagement they received. That recap is what renews sponsorships.
-
Follow up while it's fresh. Send the photo, the prize, or the survey within a day so the experience carries into an ongoing relationship.
|
Tool |
What It Helps Accomplish |
Which KPI It Helps Measure |
Practical Application |
|
Create interactive scavenger hunts and sponsor challenges |
Participation rate; completed challenges; sponsor-specific engagement |
Build a digital scavenger hunt that encourages fans to visit sponsor stations and complete trackable activities |
|
|
Run interactive trivia, polls, and branded games |
Game participation; response rates; audience preferences |
Host sponsor-branded trivia using QR codes and collect response data for post-event reporting |
|
|
Create branded photo experiences and capture participant information |
Photo sessions; lead capture; content sharing where tracked |
Set up a branded photo booth that gives fans a shareable keepsake and offers optional contact registration |
|
|
Build and engage a consent-based audience after the event |
First-party audience growth; email/SMS engagement; downstream conversions |
Send opted-in fans event photos, exclusive content, or follow-up offers and track engagement over time |
|
|
Connect gamified experiences, lead capture, and engagement reporting |
Participation; registrations; sponsor interactions |
Use branded games or photo activations to register fans and track interactions with individual sponsors |
Activation in Action: Atlanta Braves' Pose at the Plate
Turning fan engagement into something you can measure means giving fans a reason to participate in the first place.
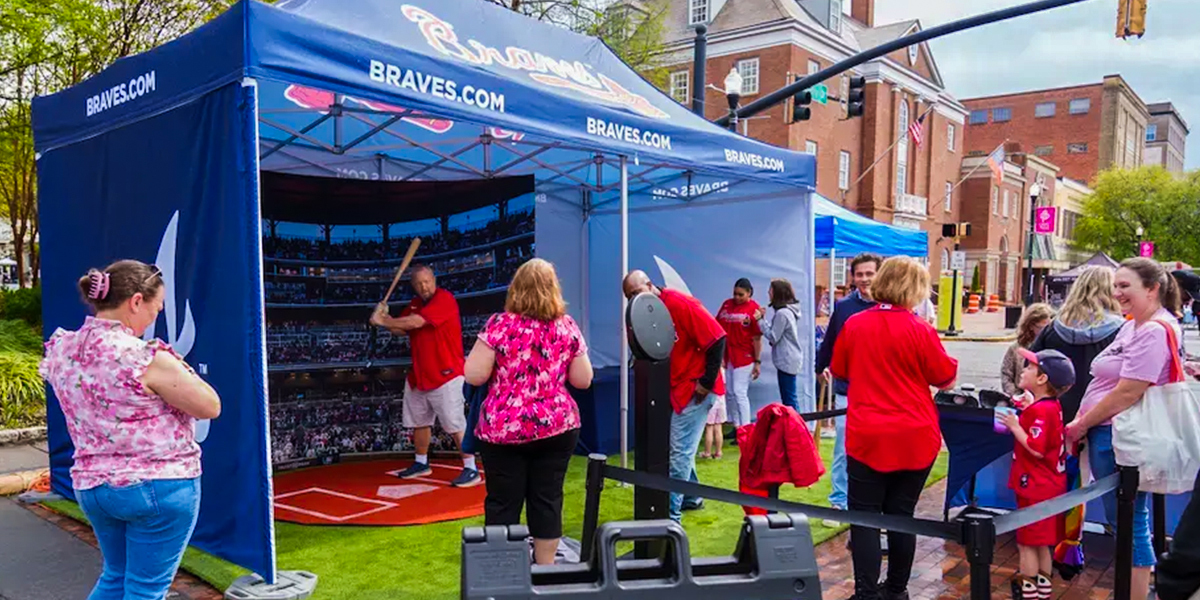
Our team at TentCraft worked with the Atlanta Braves to create a custom 10' x 20' tent for their Braves Country Road Trip, housing an interactive photo experience where fans could pose for their very own personalized baseball cards, complete with printed and digital versions.
Why does that matter? Giving fans something fun to do encourages participation. A personalized takeaway makes the experience memorable. And a digital version gives fans an easy way to share that moment beyond the event itself.
Those are all opportunities to measure engagement, encourage opt-ins, and understand how fans interact with your brand. You'd still need the right tools and consent-based data capture to make that happen, but the experience itself creates a natural starting point.
See How the Braves brought Pose at the Plate on the Road ⇒
Thank You To The Captello Team!
To learn more about Captello’s full suite of event to revenue intelligence solutions visit captello.com/ or schedule a discovery call at captello.com/demo